Description
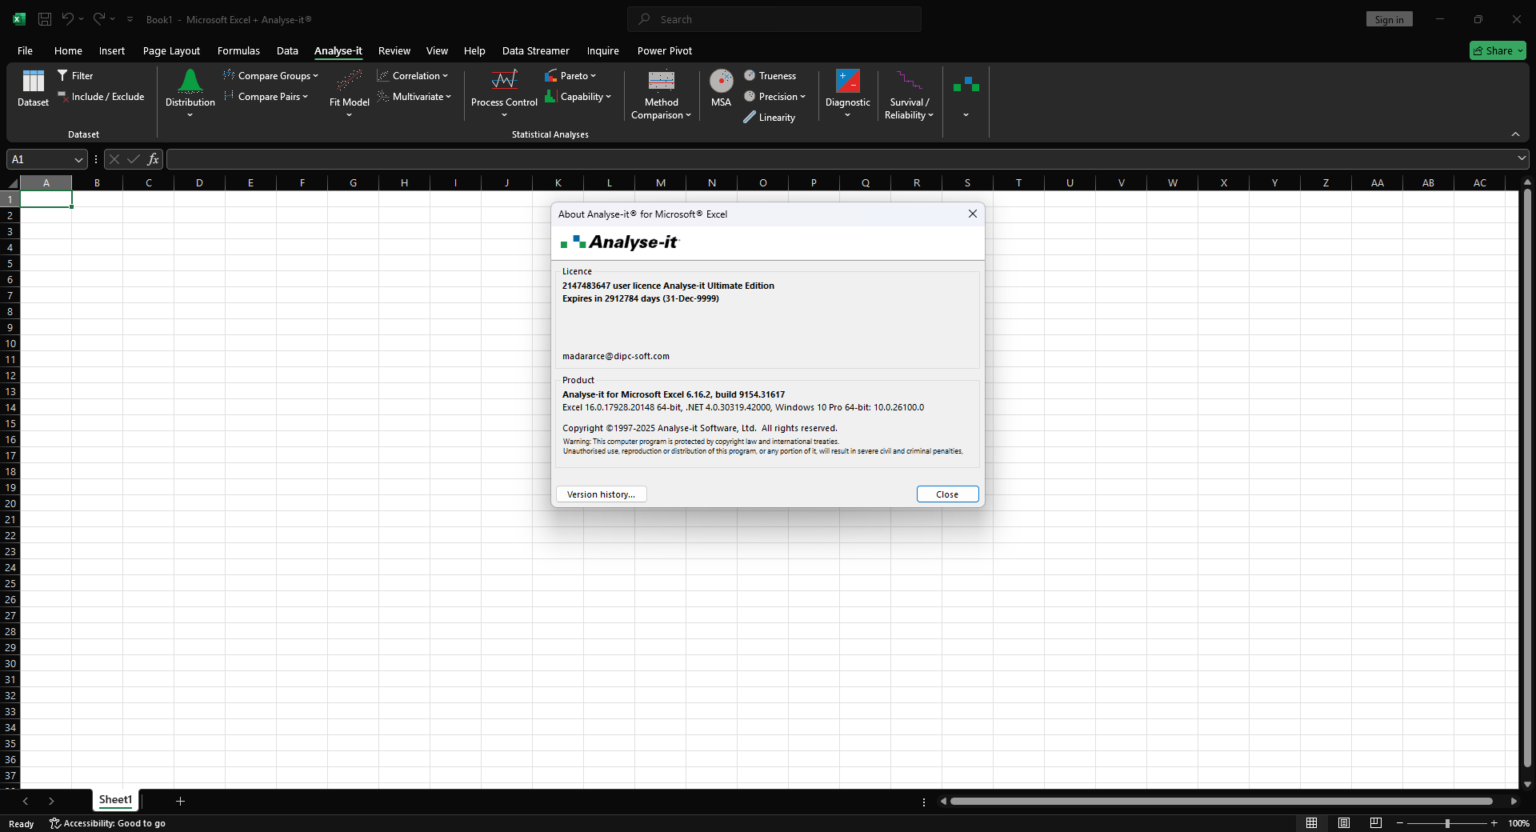
Analyse-it for Microsoft Excel Review: Professional Statistical Analysis Inside Excel
Summary
Analyse-it for Microsoft Excel is a powerful statistical analysis add-in designed for professionals who rely on Excel but require far more advanced analytical capabilities than spreadsheets alone can provide. Used widely in scientific research, quality control, engineering, healthcare, and business analytics, Analyse-it transforms Microsoft Excel into a robust statistical platform without forcing users to learn complex standalone software.
Rather than replacing Excel, Analyse-it enhances it. Users can perform sophisticated statistical tests, generate publication-ready charts, and analyze large datasets while continuing to work within a familiar spreadsheet environment. This combination of depth and accessibility makes Analyse-it especially appealing to professionals who value accuracy, transparency, and workflow efficiency.
This in-depth review examines Analyse-it for Microsoft Excel from a practical, real-world perspective, covering its features, applications, performance, strengths, limitations, pricing considerations, and overall value.
Introduction
Microsoft Excel remains one of the most widely used data tools in the world, but its native statistical capabilities are limited. For users who require advanced hypothesis testing, regression analysis, method comparison, or quality control tools, Excel alone often falls short.
Analyse-it for Microsoft Excel was created to bridge this gap. It integrates directly into Excel, adding a comprehensive suite of statistical tools while preserving Excel’s flexibility, transparency, and ease of use. Instead of exporting data to separate statistical packages, users can analyze data where it already lives.
For professionals who need defensible results, traceable calculations, and clear visual outputs, Analyse-it offers a compelling balance between advanced analytics and practical usability.
Key Features of Analyse-it for Microsoft Excel
Seamless Excel Integration
Analyse-it installs as an Excel add-in, embedding statistical tools directly into the Excel interface. This means:
-
No separate software environment
-
No data duplication
-
Immediate access to original datasets
This integration supports transparency and reduces errors caused by data transfers.
Comprehensive Statistical Tests
Analyse-it supports a wide range of statistical analyses, including:
-
Descriptive statistics
-
Parametric and non-parametric tests
-
Regression and correlation analysis
-
ANOVA and experimental design
-
Method comparison and agreement analysis
These tools make Analyse-it suitable for both exploratory analysis and formal reporting.
Advanced Graphing and Visualization
The software generates high-quality statistical charts, such as:
-
Scatter plots with confidence intervals
-
Bland-Altman plots
-
Histograms and probability plots
-
Control charts and regression visuals
Charts are fully editable within Excel, allowing users to meet presentation and publication standards.
Quality Control and Six Sigma Tools
Analyse-it includes features designed for quality improvement initiatives:
-
Control charts
-
Capability analysis
-
Process performance metrics
These tools are particularly valuable for manufacturing, engineering, and regulated industries.
Traceable and Transparent Calculations
All results are generated directly from Excel data, allowing users to:
-
Inspect formulas
-
Validate assumptions
-
Audit calculations easily
This transparency supports regulatory compliance and peer review.
Practical Use Cases
Scientific Research and Academia
Researchers use Analyse-it for Microsoft Excel to perform statistical analysis for studies, experiments, and publications. The software’s accuracy and reporting clarity make it suitable for peer-reviewed research while remaining accessible to non-statisticians.
Healthcare and Clinical Analysis
In clinical and laboratory settings, Analyse-it is frequently used for method comparison, validation studies, and diagnostic accuracy analysis. Its structured outputs support compliance with documentation and quality standards.
Engineering and Quality Assurance
Engineers rely on Analyse-it for quality control, process validation, and performance analysis. The ability to generate control charts and capability indices directly from production data improves decision-making efficiency.
Business and Market Analysis
Business analysts use Analyse-it to perform regression analysis, trend evaluation, and hypothesis testing without leaving Excel. This helps teams move from raw data to insights faster.
Education and Training
Because it operates within Excel, Analyse-it is well suited for teaching statistics. Students can focus on understanding concepts rather than learning complex software interfaces.
Performance Analysis
Speed and Responsiveness
Analyse-it performs efficiently even with large datasets. Calculations execute quickly, enabling users to explore multiple scenarios and refine analyses without delays.
Accuracy and Reliability
The software uses well-established statistical methods and algorithms, producing results consistent with professional statistical standards. This reliability is critical for research, quality control, and regulated environments.
Ease of Learning
Compared to standalone statistical software, Analyse-it has a gentle learning curve. Users familiar with Excel can begin performing meaningful analysis with minimal training.
Stability and Compatibility
Analyse-it is designed to work smoothly within supported versions of Microsoft Excel. It maintains stability during repeated analyses, making it suitable for daily professional use.
Pros & Cons
Pros
-
Deep statistical capabilities inside Excel
-
Eliminates the need for separate analysis software
-
Transparent and auditable calculations
-
High-quality charts and reports
-
Suitable for research, engineering, healthcare, and business
-
Lower learning curve compared to standalone statistical tools
Cons
-
Requires Microsoft Excel to operate
-
Advanced users may want more customization in certain analyses
-
Performance depends partly on Excel system resources
-
Not intended to replace large-scale statistical programming environments
Pricing & Plans
Analyse-it for Microsoft Excel is typically offered under commercial licensing models, which may include:
-
Individual professional licenses
-
Organizational or multi-user licenses
-
Academic and student pricing
-
Evaluation or trial versions
Pricing reflects its position as a professional statistical tool rather than a basic add-in, offering strong value for users who depend on accurate analysis.
User Experience and Professional Feedback
Professionals consistently highlight the productivity gains achieved by keeping data and analysis in one environment. Many users note that Analyse-it reduces analysis time while improving clarity and documentation quality.
Researchers appreciate the ability to generate publication-ready figures without exporting data. Quality professionals value the auditability of calculations, especially in regulated industries.
Overall, user feedback emphasizes trust, reliability, and long-term usability.
SEO Keywords Naturally Integrated
Primary keyword:
-
Analyse-it for Microsoft Excel
Long-tail and semantic keywords:
-
Analyse-it Excel statistical software
-
statistical analysis add-in for Excel
-
advanced statistics in Microsoft Excel
-
Excel data analysis software
-
professional statistical tools for Excel
These keywords are integrated naturally to support strong search visibility while maintaining a human, expert tone.
Analyse-it for Microsoft Excel Download
Analyse-it for Microsoft Excel Ultimate Edition Download
Final Verdict
Analyse-it for Microsoft Excel stands out as a practical, professional solution for users who need advanced statistical analysis without abandoning Excel. It delivers a rare combination of analytical depth, transparency, and usability.


Reviews
There are no reviews yet.